top of page

LC-MS/MS Data Analysis
2 Data Analysis
Install the Matlab Tool Peak Viewer. The software will pick peaks automatically based on highest correlation in the 12C (black) and 13C channel (orange). These are the black and orange dots. The ration between the 12C and 13C peak heights is the final read out (if you dont work with absolute concetrations).
LC-MS data analysis needs some experience. It varies between runs and with sample matrix (especially salts have a big effect).
The software does not pick every peak right. Here are the important metabolites that you must manually correct. Do this by clicking the "All Samples" radio-button, then use the slider to position the peak.
1 For targeted Metabolomcis we use LC-MS/MS. Detailed Infos in the method paper:
Aspartate
The first peak is an in-source fragment of Carbamoyl-Aspartate. The 2. peak is Aspartate

Methionine
The first peak is Methionine, the second is probably an in-source fragment of SAM:

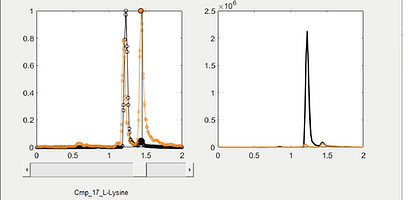
Lysine is the small peak next to glutamate
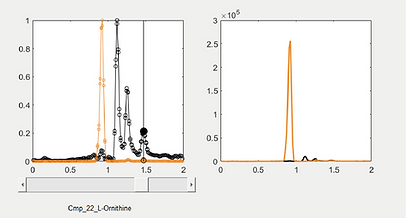
Ornithine is in E. coli very low abundant. You hardly see it in the 13C due to scaling of the high peak on the left
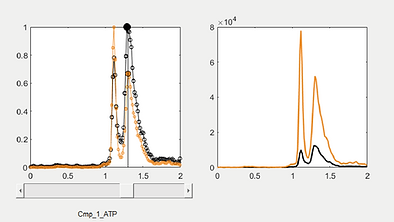
ATP is our most difficult analyte (three Ps), if you are interested in it always run standards to ensure that buffers and column are OK. If the peak looks like this the sample contains too much salt. But only the 2nd Peak is ATP. In Figure 3 of the Method paper you see an ATP spike in.
bottom of page